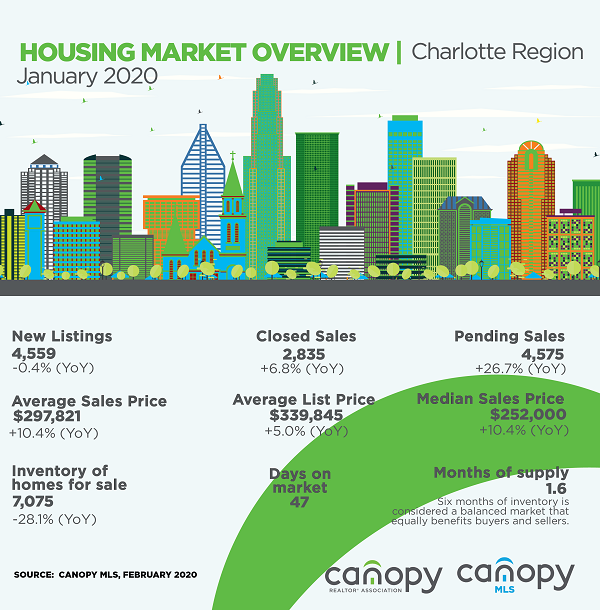
CHARLOTTE, N.C. – Home sales across the 16-county Charlotte region continued their positive run, rising 6.8 percent year-over-year with 2,835 homes sold during the month of January, according to data from Canopy MLS. Sales in January, though positive, were not nearly as strong as the previous month, declining 28.1 percent compared to December 2019.
Pending sales counts, which were up 26.7 percent year-over-year, show solid buyer demand for homes within the region. Compared to December, pending sales were up 48.9 percent. Pending sales are a forward-looking indicator and good predictor of future sales.
Prices continued to rise due to increasingly tight inventory across the region. The average list price rose 5.0 percent year-over-year to $339,845, compared with $323,714 in January 2019. Both the average sales price ($297,821) and median sales price ($252,000) rose 10.4 percent year-over-year. However, compared to December, both price indices were down 3.9 and 5.1 percent, respectively. The list price to sales price measure for January 2019 was 96.1 percent, showing sellers across the region are getting closer to their original asking price.

Though there were 4,559 new residential listings in January, new listings were down 0.4 percent compared to January 2019. However, compared to December, new listings were up 63.7 percent as sellers pushed more homes on market at the start of 2020. Strong seller’s market conditions are still prevalent, with some 7,075 homes for sale at report time. Inventory compared to January 2019 is down 28.1 percent, leaving the region with 1.6 months of supply, the lowest on record for Canopy MLS. A year ago, there were 9,842 homes on market, or 2.5 months of supply.
2020 Canopy Realtor® Association/Canopy MLS President John Kindbom remarked, “January’s home sales show we’re off to a solid and positive start to the year. Buyers will need to realize that the market is extremely tight, and homes are being sold nearly as quickly as they are listed. Prices are rising as a result of our inventory situation. And even though we’re in a strong seller’s market, homes still have to be in good condition and priced right in order to sell.”
With selling conditions largely unchanged compared to the prime selling months, homes continue to sell quickly. The average number of days a property was on the market from the time it was listed until it closed (list to close) was 99 days, while days on market, the metric that accrues for “Active” and “Under Contract-Show” statuses, averaged 47 days compared to 51 days last January.
Source: Canopy Realtor Association
Photo credits to the owner
Follow us:
IG: southcrestrealty
Twitter: southcrest2012
Facebook: SouthCrest Realty
Great content! Super high-quality! Keep it up! 🙂
You made some decent points there. I looked on the internet for the issue and found most individuals will agree with your site.
That is really fascinating, You are an overly professional blogger.
I have joined your feed and look ahead to in quest of more of your magnificent post.
Additionally, I’ve shared your website in my social networks
I do believe all the ideas you’ve introduced to your post. They’re very convincing and will certainly work. Still, the posts are too brief for beginners. May just you please prolong them a little from subsequent time? Thank you for the post.